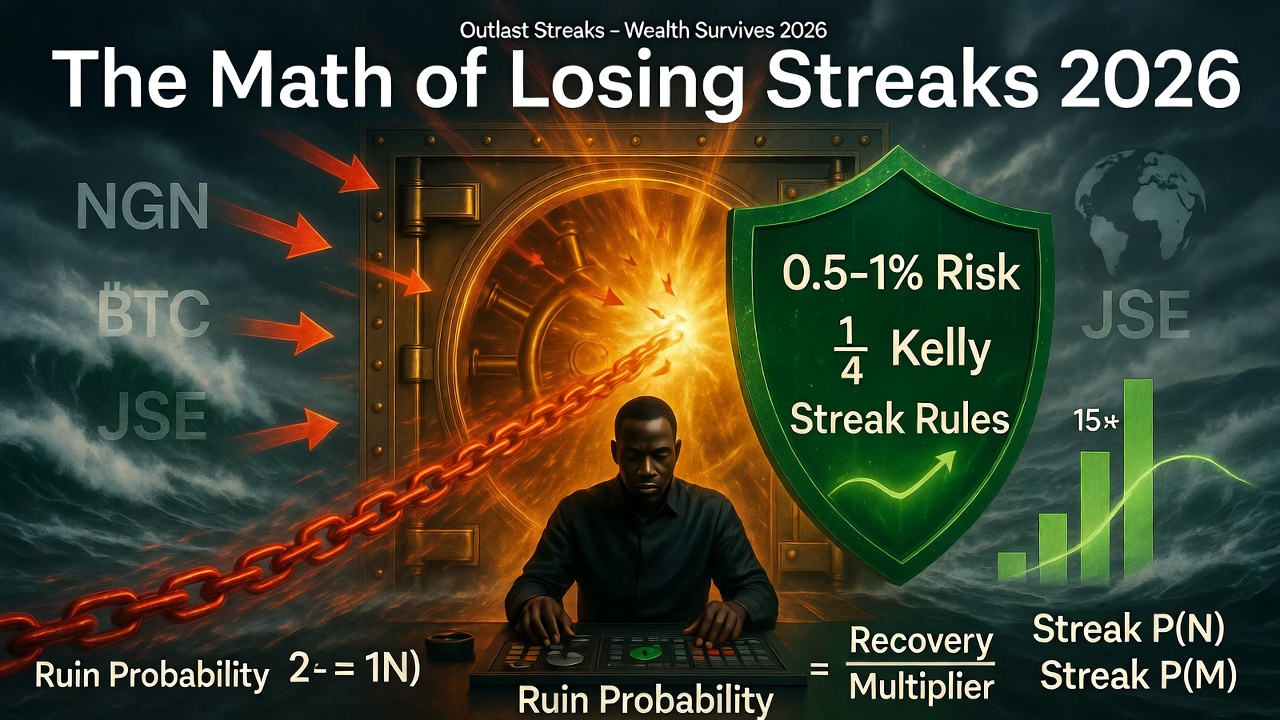
The Math of Losing Streaks 2026: Ruin Probability, Recovery Time & Psychological Survival Rules
Losing streaks are inevitable — even the best traders face them. In 2026, with persistent volatility in USD/NGN (policy shocks), crypto (halving cycle corrections), NGX/JSE equities (reform/election swings), and commodities (geopolitical oil spikes), the real difference between survivors and blow-ups is not win rate or edge size — it’s how sizing, psychology, and capital structure handle consecutive losses. A 60% win-rate strategy can still ruin an account if the streak hits at the wrong time with oversized risk.
This deep quantitative guide explores the mathematics of losing streaks in 2026: ruin probability formulas, streak length distributions, recovery time calculations, geometric drawdown impact, psychological survival thresholds, Nigerian/African trader realities (NGN pairs, diaspora USD exposure, local platform leverage), and actionable rules to never blow up — even in worst-case regimes. No charts — just pure math, survival tables, expectancy recovery logic, and step-by-step frameworks to turn inevitable streaks into temporary setbacks rather than account killers.
Why Losing Streaks Are the Real Account Killer in 2026
Historical data across markets shows even strong edges experience long losing runs:
- 50–55% win-rate strategies routinely see 8–15 consecutive losses (Bernoulli distribution).
- 2025–2026 crypto corrections produced 12–18 loss streaks on many trend-following systems.
- USD/NGN range-bound periods created 10–20 loss streaks for over-aggressive mean-reversion traders.
- NGX/JSE volatility spikes (election years, reforms) generated 7–12 loss runs even on fundamentally sound positions.
Key insight: A streak of 10 losses at 2% risk per trade = ~18% drawdown (survivable). At 5% risk = ~40% drawdown (psychologically devastating). At 10% risk = ~65% drawdown (near-ruin for most). In 2026’s regime-shifting environment, streak survival is the ultimate edge.
The Mathematics of Losing Streaks – Core Formulas
1. Probability of N Consecutive Losses
P(N losses) = (Loss %) ^ N
Example: 45% loss rate → P(10 consecutive losses) = 0.45¹⁰ ≈ 0.00034 (0.034%) — rare but inevitable over thousands of trades.
2. Geometric Drawdown After N Losses
Equity after N losses = Starting Equity × (1 – Risk%) ^ N
3. Ruin Probability (Simplified Gambler’s Ruin)
Ruin ≈ [(1 – Edge / Risk per Trade) ^ (Starting Capital / Risk per Trade)] if Edge < Risk
4. Recovery Time After Drawdown
Recovery multiplier = 1 / (1 – Drawdown %)
Example: 20% drawdown → need +25% to breakeven. 50% drawdown → need +100%.
Losing Streak Survival Tables 2026
Drawdown After Consecutive Losses – Different Risk %
| Consecutive Losses | 1% Risk | 2% Risk | 3% Risk | 5% Risk |
|---|---|---|---|---|
| 5 | -4.9% | -9.6% | -14.0% | -22.6% |
| 10 | -9.6% | -18.3% | -26.0% | -40.1% |
| 15 | -14.0% | -26.0% | -36.2% | -55.3% |
| 20 | -18.3% | -33.2% | -45.6% | -67.4% |
Recovery % Needed After Drawdown
| Drawdown % | Gain Needed to Breakeven | Trades Needed at +0.5R Expectancy |
|---|---|---|
| 10% | +11.1% | ~22 trades |
| 20% | +25.0% | ~50 trades |
| 40% | +66.7% | ~133 trades |
| 60% | +150% | ~300 trades |
Ruin Probability & Recovery Math by Risk %
Full Kelly (High Growth, High Ruin Risk)
- Typical f ≈ 8–15% → 50–80% drawdown common → ruin probability >20% over long horizons.
- 2026 reality: Crypto/FX volatility spikes make full Kelly suicidal for retail.
Fractional Kelly (Balanced Survival)
- ¼–½ Kelly → f ≈ 2–5% → max drawdown 15–35% → ruin probability <1% over thousands of trades.
- Best for most retail traders in 2026 (USD/NGN, BTC, NGX).
Psychological Survival Rules for Streaks 2026
- Pre-Define Max Drawdown Threshold: 15–25% acceptable → set sizing so 15–20 losses doesn’t exceed it.
- Streak Counter Rule: After 8–10 consecutive losses → halve risk % until +2R recovery or regime confirmation.
- Capital Preservation Pause: After 25–30% drawdown → stop live trading, demo/paper until equity recovers 10%.
- Psychological Reset: Journal streak emotions, review sizing math — never revenge trade or increase size to “catch up”.
- 2026 Nigerian Context: NGN conversion costs + platform leverage gaps amplify streak pain — keep 20–30% in stable USD/high-yield naira buffer.
Step-by-Step Streak Survival Framework 2026
- Calculate Ruin Threshold: Max acceptable drawdown (20–30%) → back-calculate max risk % for 15–20 loss streak.
- Set Base Risk: Start at 0.5–1.5% (fractional Kelly ¼–½).
- Monitor Streak Length: After 6–8 losses → reduce risk 50% until +1R streak or regime shift.
- Recovery Phase: After drawdown → lower risk further until equity +10–15% → gradually return to base.
- Review & Journal: Post-streak — analyze sizing impact, psychological triggers, regime misread — adjust for next cycle.
FAQs
- What is the longest realistic losing streak in 2026? 12–20 consecutive losses even with 55–60% edge — plan for it.
- How much drawdown is psychologically survivable? 15–25% for most retail traders — beyond 30–40% → tilt/revenge trading spikes.
- Does higher win rate reduce streak risk? Yes — 70% win rate → P(10 losses) ≈ 0.00034 vs 0.006 for 50%.
- What recovery % is needed after 40% drawdown? +66.7% — takes 2–3× longer than the drawdown time with same expectancy.
- Is USD/NGN more streak-prone than EUR/USD? Yes — policy shocks create longer losing runs — size 0.5–1% max.
- Can fractional Kelly eliminate ruin risk? No — reduces it to near-zero over thousands of trades if f < 0.5.
- How to handle 15-loss streak psychologically? Pre-defined rule: halve risk after 8 losses, journal emotions, demo trade until +2R.
- 2026 markets most likely to produce long streaks? Crypto (trend exhaustion), USD/NGN (policy fakeouts), low-liquidity NGX stocks.
- Should I pause trading during streaks? Yes — after 25% drawdown or 12–15 losses → paper trade until equity +10% or regime clarity.
- What is the biggest mistake during losing streaks? Increasing size to “catch up” — geometric ruin accelerates.
- Where to start today? Calculate your current equity’s 1% risk dollar amount, simulate 15-loss streak drawdown, set max drawdown rule (20–25%), and apply strict sizing to your next 10 setups.
- Can a strong edge survive any streak? No — without proper sizing, even +1R expectancy eventually ruins if f is too high.
Related Articles
- Position Sizing Mastery 2026
- Mean Reversion vs Trend Following 2026
- Stop-Loss & Take-Profit Theory 2026
- Trading Discipline in 2026
- Risk Management for Beginners 2026
Motivational Conclusion
Losing streaks are not failures — they are tests of your math, discipline, and respect for probability. In 2026’s volatile, regime-shifting markets — from Lagos USD/NGN trades to global crypto swings — the trader who sizes conservatively, enforces streak rules, and treats drawdowns as temporary tuition will survive long enough for the edge to compound into freedom. You don’t need to avoid streaks — you need to outlast them. Every loss in a streak is a reminder: capital is finite, probability is patient. Protect your capital ruthlessly, size wisely, and let time turn temporary pain into permanent gain. Your next streak is coming. Be ready — thrive through it.
Call-to-Action: What is the longest losing streak you’ve experienced so far, and what risk % would have kept your drawdown under 25%? Share in the comments — let’s build a community of streak-surviving traders. Calculate your current equity’s max risk for a 15-loss streak today, set a hard drawdown rule (20–25%), and enforce it on your next 5–10 setups. Streak-proof today — wealth compounds tomorrow.
