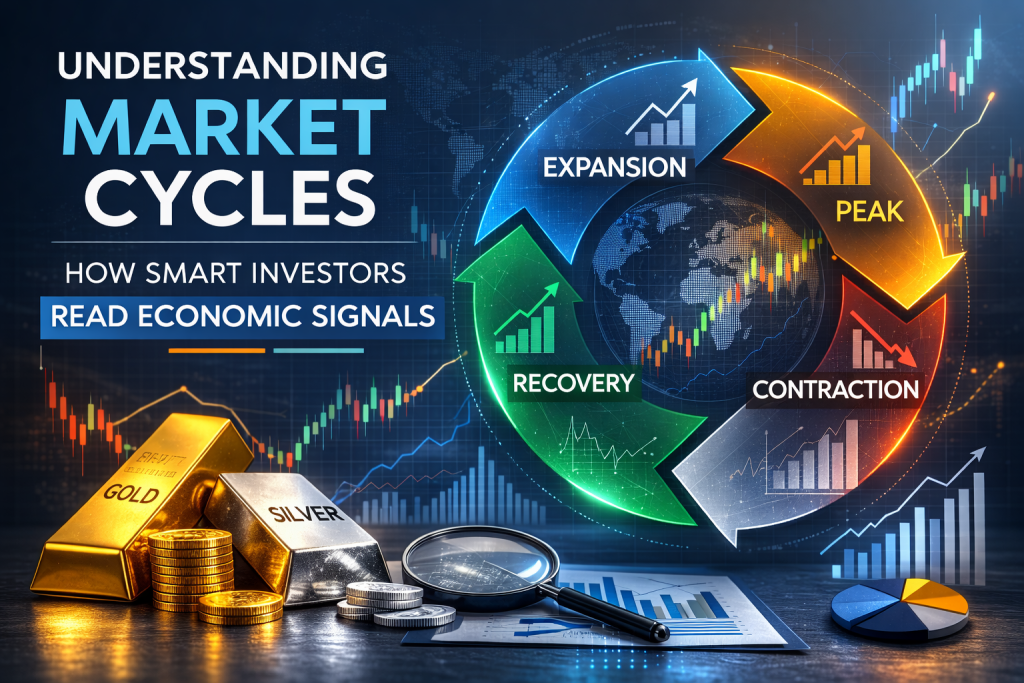
Financial markets rise and fall in cycles, but the turning points between growth and decline often appear confusing to everyday investors. Market tops form when optimism is high and risk is overlooked, while market bottoms occur when fear dominates and assets are undervalued.
Smart investors do not rely on guesswork to recognize these turning points. Instead, they study economic indicators, financial conditions, and investor sentiment to understand when markets may be overheating or stabilizing.
This guide explains how beginners can identify market tops and bottoms using clear, data-driven signals — without needing complex financial models.
What Are Market Tops and Bottoms?
A market top is the point at which asset prices reach a peak before beginning a downward trend.
A market bottom is the point at which prices stabilize after a decline and begin to rise again.
These turning points rarely occur on a single day. Instead, they form gradually as economic conditions change.
Recognizing early warning signals helps investors:
- Protect profits
- Avoid buying overvalued assets
- Identify discounted investment opportunities
- Reduce emotional decision-making
Why Identifying Turning Points Matters
Understanding when markets may be nearing a top or bottom allows investors to make smarter financial decisions.
Benefits of Recognizing Market Tops
- Lock in profits before declines
- Reduce exposure to high-risk assets
- Increase cash reserves
- Rebalance portfolios
Benefits of Recognizing Market Bottoms
- Buy quality assets at discounted prices
- Position for recovery growth
- Increase long-term returns
- Avoid fear-driven selling
While no indicator predicts turning points perfectly, combining multiple signals improves decision-making.
Key Economic Indicators That Signal Market Tops
Market tops often occur when the economy appears strong but underlying risks are rising.
Below are the most reliable indicators.
Rising Inflation Rates
Inflation measures how quickly prices increase across the economy.
During late expansion stages, demand often exceeds supply, causing inflation to rise.
When inflation rises too quickly:
- Purchasing power declines
- Central banks raise interest rates
- Borrowing becomes more expensive
- Economic growth slows
Historically, high inflation has preceded market corrections.
Increasing Interest Rates
Central banks raise interest rates to control inflation and prevent overheating.
Higher interest rates:
- Increase borrowing costs
- Reduce consumer spending
- Slow business expansion
- Pressure stock valuations
Rising rates have historically contributed to market slowdowns.
Investors should monitor rate decisions and policy statements from central banks.
Overvalued Stock Market Metrics
Market tops often occur when stocks become overpriced relative to earnings.
Important valuation metrics include:
Price-to-Earnings Ratio (P/E Ratio)
A high P/E ratio suggests investors are paying excessive prices for future earnings.
Market Capitalization to GDP Ratio
When total market value significantly exceeds economic output, markets may be overvalued.
Price-to-Sales Ratio
Elevated levels may indicate speculative pricing.
Extreme valuations signal elevated risk levels.
Excessive Investor Optimism
Investor sentiment can indicate risk extremes.
Signs of excessive optimism include:
- Rapid growth in speculative trading
- Surge in retail investor activity
- “Get rich quick” investment trends
- Media hype around markets
- Dismissal of risk warnings
Historically, extreme optimism often occurs before market downturns.
High Consumer Debt Levels
When consumers accumulate excessive debt, spending eventually slows.
High debt levels may lead to:
- Reduced consumption
- Loan defaults
- Banking sector stress
- Economic slowdown
This can signal late-cycle economic stress.
Key Indicators That Signal Market Bottoms
Market bottoms form when fear is widespread and economic conditions appear bleak.
However, early signs of stabilization often emerge before recovery begins.
Declining Inflation
When inflation begins to slow, it signals reduced price pressure.
This may allow central banks to pause or reduce interest rates.
Lower inflation supports economic recovery and investor confidence.
Interest Rate Stabilization or Cuts
When central banks stop raising rates or begin cutting them, it often signals economic support measures.
Lower rates:
- Encourage borrowing
- Support business growth
- Increase market liquidity
- Stimulate investment
Historically, markets begin recovering before economic data improves.
Improving Employment Trends
Employment is a key measure of economic health.
During downturns, job losses rise. However, stabilization in unemployment often signals recovery ahead.
Investors watch for:
- Slowing job losses
- Stabilizing unemployment rates
- Gradual hiring improvements
Labor market stabilization often precedes market recovery.
Market Capitulation and Panic Selling
Market bottoms often form when investors panic and sell aggressively.
Signs include:
- Sharp market declines
- High trading volume during selloffs
- Extreme fear in financial media
- Investors abandoning long-term strategies
Historically, periods of extreme fear create buying opportunities.
Attractive Valuations
After significant declines, assets become undervalued relative to earnings and long-term growth.
Indicators include:
- Low P/E ratios
- Dividend yields rising
- Discounted blue-chip stocks
- Historically low valuation multiples
Long-term investors often find opportunities during these conditions.
Understanding Investor Sentiment Indicators
Investor psychology provides insight into market turning points.
Two widely followed sentiment tools include:
Fear & Greed Index
This indicator measures market emotion using volatility, momentum, and demand indicators.
- Extreme greed suggests overconfidence
- Extreme fear may indicate buying opportunities
Volatility Index (VIX)
The VIX measures market volatility expectations.
High volatility often occurs near market bottoms.
Low volatility during market highs may signal complacency.
Leading vs Lagging Indicators
Understanding the difference between leading and lagging indicators improves analysis.
Leading Indicators
These provide early warning signals:
- Interest rate changes
- Consumer confidence
- Stock market trends
- Manufacturing activity
Lagging Indicators
These confirm trends after changes occur:
- Unemployment rates
- GDP growth data
- Corporate earnings reports
Smart investors combine both for better insights.
Why Market Timing Is Difficult
Even professional investors cannot consistently predict exact tops and bottoms.
Reasons include:
- Unexpected global events
- Policy changes
- Investor psychology shifts
- Market overreactions
Instead of perfect timing, investors should focus on probability and risk management.
Practical Strategy: Using Indicators Without Guessing
Rather than attempting to predict exact turning points, investors can use indicators to guide decisions.
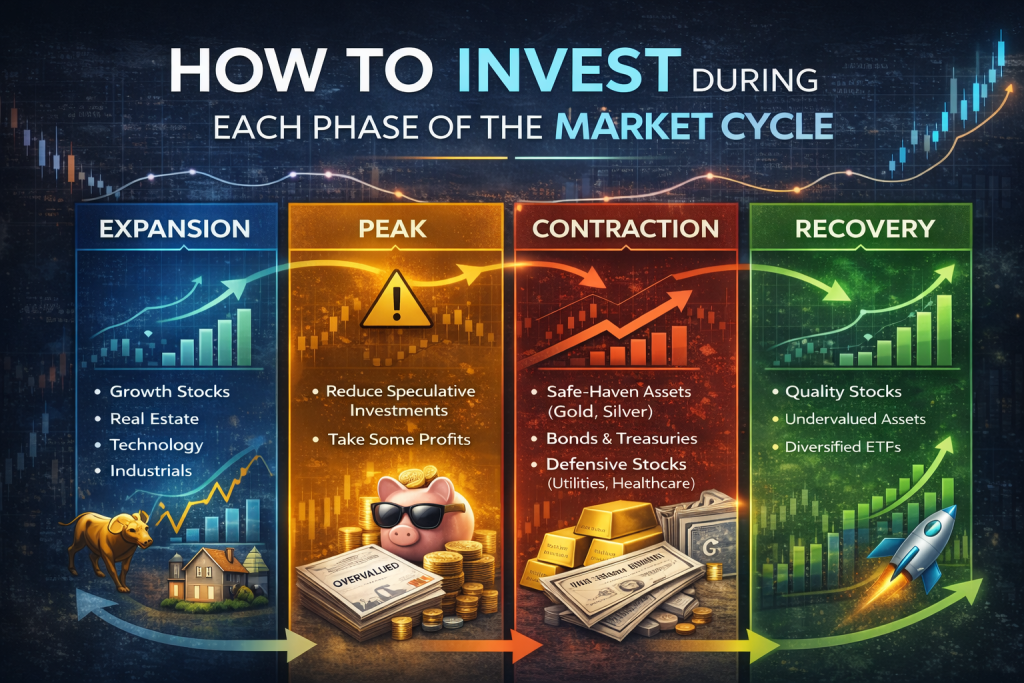
Near Market Tops
- Reduce high-risk investments
- Take partial profits
- Increase diversification
- Maintain cash reserves
Near Market Bottoms
- Begin gradual buying
- Focus on quality assets
- Invest consistently over time
- Maintain long-term perspective
This approach reduces emotional decision-making.
Common Mistakes When Identifying Market Turning Points
Avoid these frequent errors:
- Trying to predict exact tops and bottoms
- Following crowd sentiment blindly
- Ignoring economic data
- Panic selling during declines
- Waiting too long to re-enter markets
Discipline and patience remain essential.
Combining Indicators for Better Decision-Making
No single indicator provides certainty.
However, when multiple signals align, they provide stronger evidence.
Example: Signals of a Market Top
- Rising inflation
- Interest rate hikes
- Overvalued stocks
- Extreme optimism
Example: Signals of a Market Bottom
- Declining inflation
- Rate cuts or pauses
- Panic selling
- Attractive valuations
Combining indicators improves decision confidence.
Long-Term Perspective: The Investor’s Advantage
Market cycles are temporary. Long-term growth has historically favored patient investors.
By understanding economic signals and maintaining discipline, investors can avoid costly emotional decisions and position themselves for sustainable growth.
Final Thoughts
Market tops and bottoms are not random events. They develop gradually as economic conditions shift and investor sentiment changes.
By monitoring inflation, interest rates, valuations, employment trends, and investor psychology, beginners can better understand when markets may be overheating or stabilizing.
Although no indicator guarantees perfect timing, combining multiple signals allows investors to make informed, strategic decisions.
Patience, discipline, and a data-driven approach remain the foundation of successful investing.
Understanding turning points does not mean predicting the future — it means preparing wisely for it.

Pingback: Understanding Market Cycles: How Smart Investors Read Economic Signals — The Capital Process