Introduction: Beyond CAPM
The Capital Asset Pricing Model (CAPM) taught investors an essential lesson:
- Risk (measured by Beta) determines expected return.
- The market compensates investors for systematic risk.
Yet real-world research showed a problem:
- Some stocks consistently outperformed what CAPM predicted.
- Beta alone could not explain differences in returns.
This led to the Fama-French Three-Factor Model, developed by Eugene Fama and Kenneth French in the 1990s.
This model adds two additional factors to Beta:
- Size (SMB – Small Minus Big)
- Value (HML – High Minus Low)
These factors help explain returns that CAPM could not, giving investors a more accurate framework.
In this article, you will learn:
- The problem with CAPM
- What SMB and HML factors are
- The full Fama-French formula
- How this model differs from CAPM
- Practical applications in portfolio management
- Factor investing and ETFs
- Strengths and limitations
- How investors can use this knowledge today
1. The Problem with CAPM
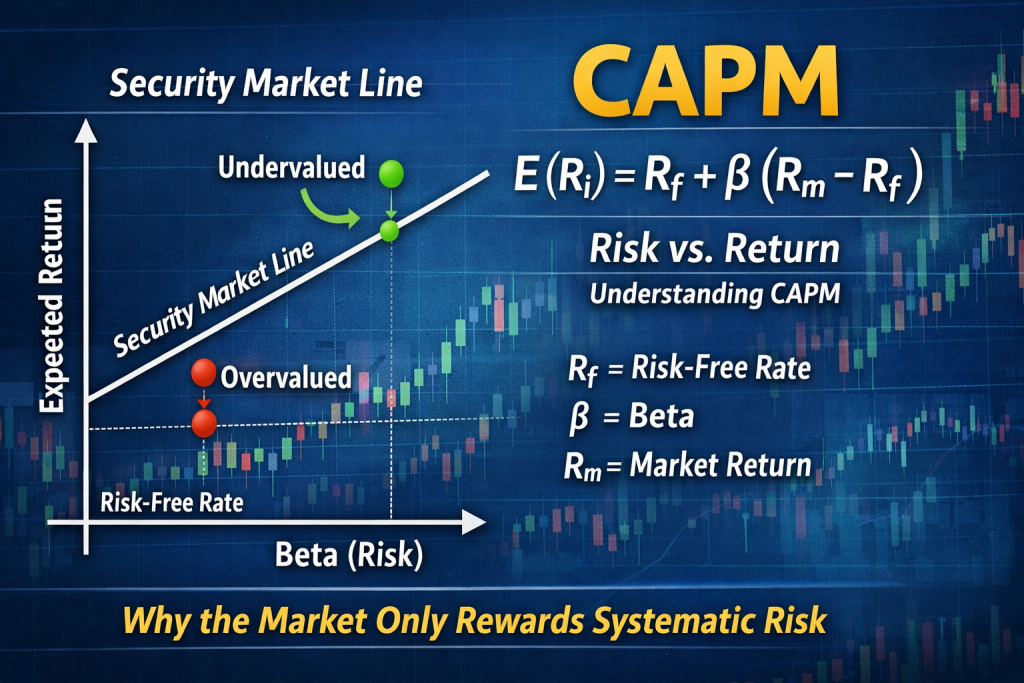
CAPM assumes:
[
E(R_i) = R_f + \beta_i (R_m – R_f)
]
Where Beta captures systematic market risk.
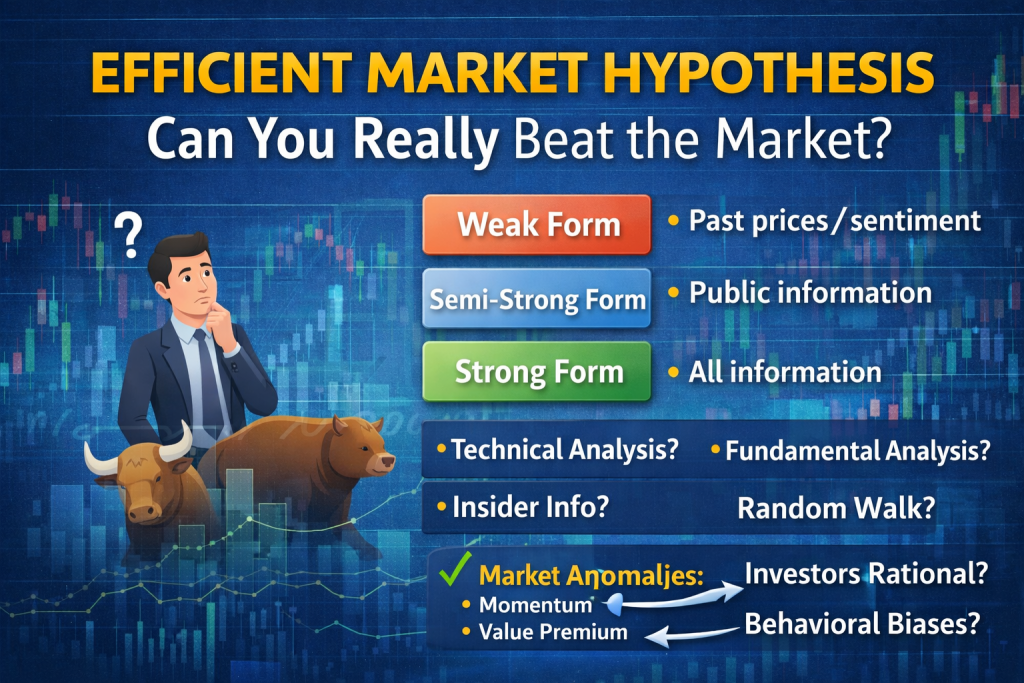
Yet research in the 1970s-80s revealed patterns CAPM couldn’t explain:
- Small-cap outperformance: Smaller companies earned higher returns than Beta predicted.
- Value stock outperformance: Stocks with high book-to-market ratios (value stocks) outperformed growth stocks.
These patterns are called market anomalies, and they challenged the idea that Beta alone explains returns.
2. The Size Effect: SMB (Small Minus Big)
The Size Effect reflects that:
- Small-cap stocks tend to outperform large-cap stocks over long periods.
Fama and French quantified this as:
- SMB (Small Minus Big) = average return of small-cap portfolios − average return of large-cap portfolios
This factor captures the extra return investors earn for holding smaller, riskier companies.
Example:
- Small-cap ETF return = 12%
- Large-cap ETF return = 9%
- SMB factor = 3%
3. The Value Effect: HML (High Minus Low)
The Value Effect reflects that:
- Stocks with high book-to-market ratios (value stocks) outperform low book-to-market (growth) stocks.
HML (High Minus Low) = average return of high book-to-market portfolios − average return of low book-to-market portfolios
This factor captures returns related to undervalued or “cheap” stocks.
Example:
- High B/M portfolio = 14%
- Low B/M portfolio = 10%
- HML factor = 4%
4. The Fama-French Three-Factor Formula
The formula extends CAPM:
[
E(R_i) – R_f = \alpha + \beta_i (R_m – R_f) + s_i \cdot SMB + h_i \cdot HML + \epsilon
]
Where:
- E(Ri) = expected return of stock i
- Rf = risk-free rate
- βi = market Beta (systematic risk)
- s_i = sensitivity to SMB (size factor)
- h_i = sensitivity to HML (value factor)
- ε = residual (unexplained return)
- α = intercept (abnormal return not explained by factors)
Key points:
- β still measures market risk.
- s_i measures how sensitive the stock is to small vs large company returns.
- h_i measures sensitivity to value vs growth returns.
5. Comparison: CAPM vs Fama-French
| Feature | CAPM | Fama-French 3-Factor |
|---|---|---|
| Risk Factors | Beta only | Beta + SMB + HML |
| Explains | Market risk | Market + size + value |
| Predictive Power | Limited for anomalies | Stronger across small & value stocks |
| Use in Practice | Cost of equity, valuation | Factor investing, portfolio tilt |
| Limitations | Ignores other anomalies | Still doesn’t capture momentum, liquidity, behavior |
In short:
- CAPM = simple, foundational
- Fama-French = more accurate and practical for real-world returns
6. Practical Applications in Portfolio Management
6.1 Factor Investing
Investors can tilt portfolios toward:
- Small-cap stocks → higher potential return
- Value stocks → capture HML premium
6.2 ETFs and Index Funds
Many factor-based ETFs replicate Fama-French factors:
- Small-cap value ETFs
- Value-weighted indexes
Investors can gain factor exposure passively.
6.3 Risk Management
Understanding s_i and h_i helps:
- Assess factor exposure
- Diversify beyond market Beta
- Reduce portfolio volatility
7. Real-World Example
Suppose you have a portfolio:
- Beta = 1.1
- s_i = 0.6 (small-cap tilt)
- h_i = 0.8 (value tilt)
Expected excess return:
- Market factor = 8%
- SMB = 3%
- HML = 2%
Contribution:
- Beta contribution = 1.1 × 8% = 8.8%
- SMB contribution = 0.6 × 3% = 1.8%
- HML contribution = 0.8 × 2% = 1.6%
Total expected excess return = 12.2%
This illustrates how factor exposure affects portfolio return beyond CAPM Beta.
8. Strengths of the Fama-French Model
- Explains anomalies CAPM cannot
- Provides a framework for factor investing
- Widely adopted in academic research
- Practical for portfolio construction
9. Limitations
- Does not include momentum (other factors exist)
- Requires detailed portfolio data
- Historical factor premiums may not persist
- Sensitive to market regime changes
10. How It Changed Modern Investing
The Fama-French model:
- Inspired factor-based ETFs
- Influenced portfolio management strategies
- Provided a deeper understanding of systematic risk beyond Beta
It showed:
Investors are rewarded not just for market risk, but also for exposure to size and value factors.
11. Practical Advice for Investors
For retail investors:
- Consider diversified factor ETFs
- Use small-cap and value tilts for long-term potential
- Understand your factor exposure alongside Beta
- Avoid over-concentration or chasing short-term anomalies
- Keep fees low and focus on long-term returns
This balances academic theory with real-world application.