Financial theory tells us that markets are efficient.
Prices reflect all available information.
Investors act rationally.
Abnormal profits should not consistently exist.
This idea is the foundation of the Efficient Market Hypothesis (EMH).
But when researchers examined real-world data, they discovered something surprising:
Markets sometimes behave in predictable, abnormal ways.
Certain stocks outperform repeatedly.
Some calendar months show unusual patterns.
Low-risk stocks sometimes outperform high-risk ones.
Momentum strategies keep working across decades.
These persistent irregularities are known as market anomalies.
In this deep dive, you will learn:
- What market anomalies are
- Why they challenge market efficiency
- The most important documented anomalies
- Risk-based vs behavioral explanations
- Whether anomalies disappear over time
- How investors can use them intelligently
Let’s begin.
1. What Is a Market Anomaly?
A market anomaly is a pattern in financial markets that contradicts the predictions of traditional financial theory.
If markets are perfectly efficient:
- No strategy should consistently outperform after adjusting for risk.
- Prices should instantly incorporate all information.
- Past data should not predict future returns.
Yet empirical evidence shows recurring patterns that generate excess returns.
An anomaly exists when:
- A predictable pattern appears in asset prices.
- The pattern cannot be fully explained by standard risk models.
- The effect persists over long periods.
Anomalies do not mean markets are broken.
They mean markets are influenced by complexity, risk structures, and human behavior.
2. Why Anomalies Challenge Market Efficiency
The Efficient Market Hypothesis argues:
- Weak Form: Past prices cannot predict future prices.
- Semi-Strong Form: Public information is fully reflected in prices.
- Strong Form: Even private information is reflected in prices.
Market anomalies challenge especially the weak and semi-strong forms.
For example:
If momentum works — meaning past winners continue to outperform — then past prices do predict future returns.
If value stocks outperform growth stocks, then price-to-book ratios contain predictive power.
These patterns should not exist in a perfectly efficient market.
Yet they do.
3. The Size Effect
The Size Effect refers to the tendency of small-cap stocks to outperform large-cap stocks over long periods.
This anomaly suggests:
Smaller companies generate higher average returns than larger companies.
Possible explanations:
Risk-Based View:
Small companies are riskier. Investors demand higher returns.
Behavioral View:
Investors neglect small companies due to lack of media coverage and analyst attention.
The size effect was one of the reasons the Fama-French Three-Factor Model expanded beyond CAPM.
It introduced the SMB factor (Small Minus Big) to capture this anomaly.
4. The Value Effect
The Value Effect describes the tendency of undervalued stocks (low price-to-book, low price-to-earnings) to outperform growth stocks.
Value stocks:
- Appear cheap relative to fundamentals.
- Often face temporary distress or pessimism.
Growth stocks:
- Have high expectations.
- Often priced for perfection.
Over time, value stocks have historically outperformed.
Explanations:
Risk-Based:
Value stocks are riskier during economic downturns.
Behavioral:
Investors overreact to bad news, pushing value stocks too low.
The value premium became a cornerstone of factor investing.
5. The Momentum Effect
Momentum is one of the strongest and most persistent anomalies.
It suggests:
Stocks that performed well in the past 6–12 months tend to continue performing well in the near future.
Conversely:
Poor performers often continue underperforming.
This directly contradicts the weak form of EMH.
Possible explanations:
Behavioral:
Investors underreact to new information initially.
Institutional:
Fund managers chase performance trends.
Momentum has been documented across:
- Stocks
- Bonds
- Commodities
- Currencies
It is one of the most robust anomalies in finance.
6. The January Effect
The January Effect refers to the historical tendency of small-cap stocks to perform particularly well in January.
Possible explanations:
- Tax-loss selling in December followed by repurchasing in January.
- Institutional window dressing.
- Seasonal investor behavior.
Though weaker today, this anomaly was historically significant.
It demonstrated that calendar timing sometimes affects returns.
7. Post-Earnings Announcement Drift (PEAD)
Post-Earnings Announcement Drift occurs when:
Stocks continue moving in the direction of an earnings surprise for weeks or months after the announcement.
If earnings are much higher than expected:
The stock continues rising gradually.
If earnings disappoint:
The stock continues declining.
This suggests investors do not instantly incorporate information — contradicting semi-strong EMH.
8. The Low Volatility Anomaly
Traditional finance predicts:
Higher risk should lead to higher returns.
But research shows:
Low-volatility stocks sometimes outperform high-volatility stocks on a risk-adjusted basis.
This contradicts CAPM.
Possible explanations:
Behavioral:
Investors overpay for “lottery-like” high-volatility stocks.
Institutional:
Leverage constraints push investors toward high-beta stocks.
Low-volatility strategies are now widely implemented in ETFs.
9. Why Do Anomalies Persist?
If anomalies are known, why don’t they disappear?
Possible reasons:
- Risk Compensation
Some anomalies may reflect hidden risk. - Behavioral Biases
Psychological biases persist across generations. - Institutional Constraints
Fund managers face benchmarks and career risk. - Limits to Arbitrage
Even if investors recognize mispricing, correcting it may be costly or risky.
Markets are competitive — but not frictionless.
10. Risk-Based vs Behavioral Explanations
There are two main schools of thought:
Risk-Based Explanation:
Anomalies are compensation for hidden risks not captured in simple models.
Behavioral Explanation:
Anomalies arise from systematic investor biases.
For example:
Value Premium:
Risk view — value stocks are distressed.
Behavioral view — investors overreact to bad news.
Momentum:
Risk view — exposure to economic shocks.
Behavioral view — underreaction and herding.
The truth may lie somewhere in between.
11. Practical Applications for Investors
How can investors use anomalies?
- Factor Investing
Tilt portfolios toward value, size, or momentum. - Diversification
Combine multiple factors to reduce cyclicality. - Systematic Discipline
Use rule-based strategies instead of emotional timing. - Long-Term Horizon
Many anomalies require patience.
However:
Anomalies are not guarantees.
They can underperform for years before rewarding investors.
12. Do Anomalies Disappear Over Time?
Some anomalies weaken after discovery.
Why?
- More investors exploit them.
- Markets adapt.
- Arbitrage increases.
However, many major anomalies — like value and momentum — have persisted for decades.
This suggests they are rooted in deep structural or behavioral forces.
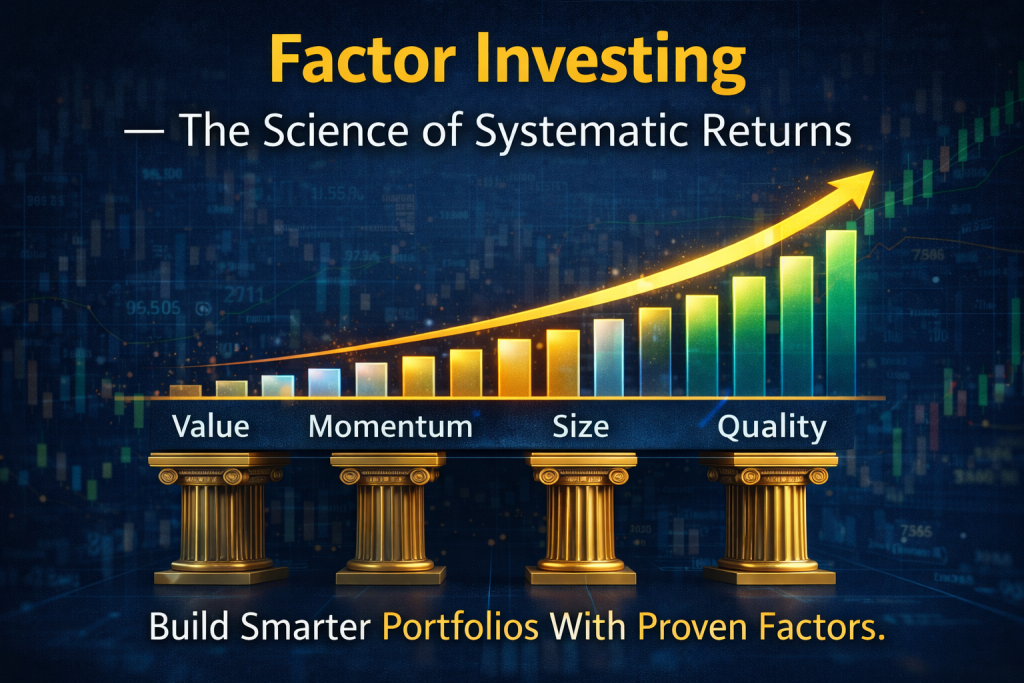
13. The Evolution Toward Factor Investing
Market anomalies led to the rise of factor investing.
Instead of selecting individual stocks based on intuition, investors:
- Target systematic factors
- Build diversified portfolios
- Capture long-term premiums
Modern ETFs now implement:
- Value strategies
- Momentum strategies
- Low-volatility strategies
- Multi-factor portfolios
What began as academic anomalies evolved into mainstream investing tools.
14. Final Thoughts
Market anomalies remind us of an important truth:
Markets are competitive — but not perfectly efficient.
Human behavior, institutional constraints, and structural risks create recurring patterns.
For investors, the lesson is clear:
- Understand theory.
- Respect risk.
- Stay disciplined.
- Avoid emotional decisions.
- Consider systematic factor exposure.
Anomalies do not promise easy profits.
But they reveal that markets are shaped by more than equations.
They are shaped by people.
And people are not perfectly rational.